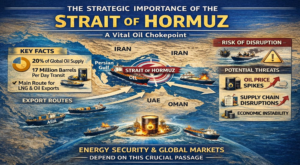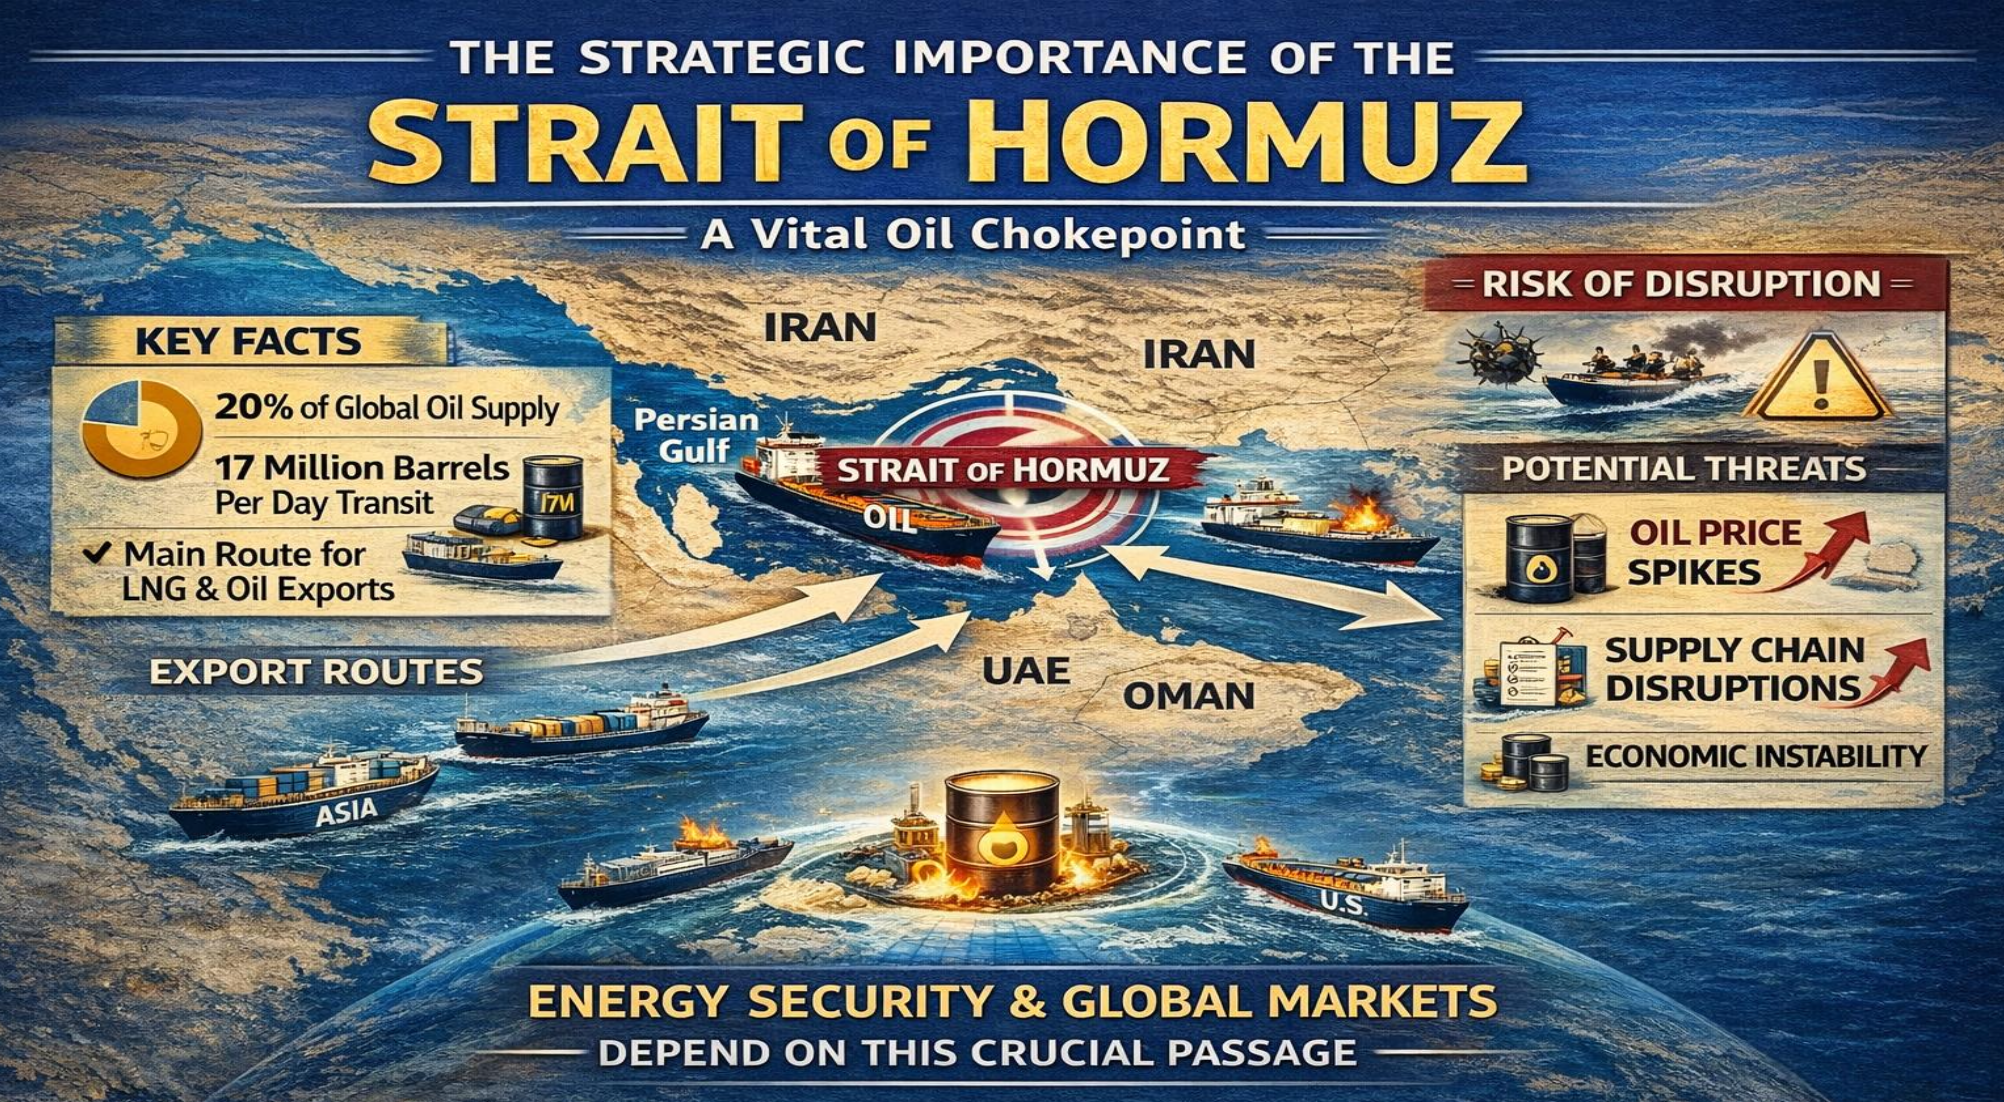
In late February 2026, the United States and Israel launched coordinated strikes on Iran’s military and nuclear infrastructure. Reports suggest Iran’s Supreme Leader Ayatollah Khamenei was killed in the attacks . Iran retaliated with missiles and drones across the Gulf, targeting Israeli territory and U.S. military bases in the region . This has broadened into a multi-state confrontation: Iran has struck bases in the UAE, Qatar, Kuwait, Saudi Arabia, Oman and Israel, and there are now concerns of a partial blockade of the Strait of Hormuz . The Strait of Hormuz is a vital chokepoint – roughly 20% of global crude and LNG ship through it – so any disruption stokes energy market volatility.
The conflict’s macroeconomic impact depends heavily on its duration and scope. Three broad scenarios are in discussion: a quick resolution, a prolonged but limited conflict (several weeks of uncertainty without full oil cutoff), or a long war/escalation (months of fighting, including a sustained Hormuz blockade and wider regional spillovers) . Base‐case forecasts (2–4 week horizon) see near-term Brent crude around $70–95/barrel . In this scenario, risk premia push prices up, but ample spare capacity and inventories suggest any spike would recede once tensions ease. By contrast, if the “long war” scenario materializes (Hormuz closed 3+ weeks, Iran proxies involved), analysts warn Brent could reach $100–120+ – a true supply shock rather than a temporary premium. The intensity of fighting and whether oil infrastructure (e.g. Saudi/UAE refineries, pipelines) is hit are key uncertainties. One research team notes that if infrastructure holds and the strait reopens, prices might revert toward $60–70 by late 2026 , similar to patterns after the peak of the 2022 Ukraine crisis. In a severe escalation, however, prices could stay elevated well above $100 for an extended period.
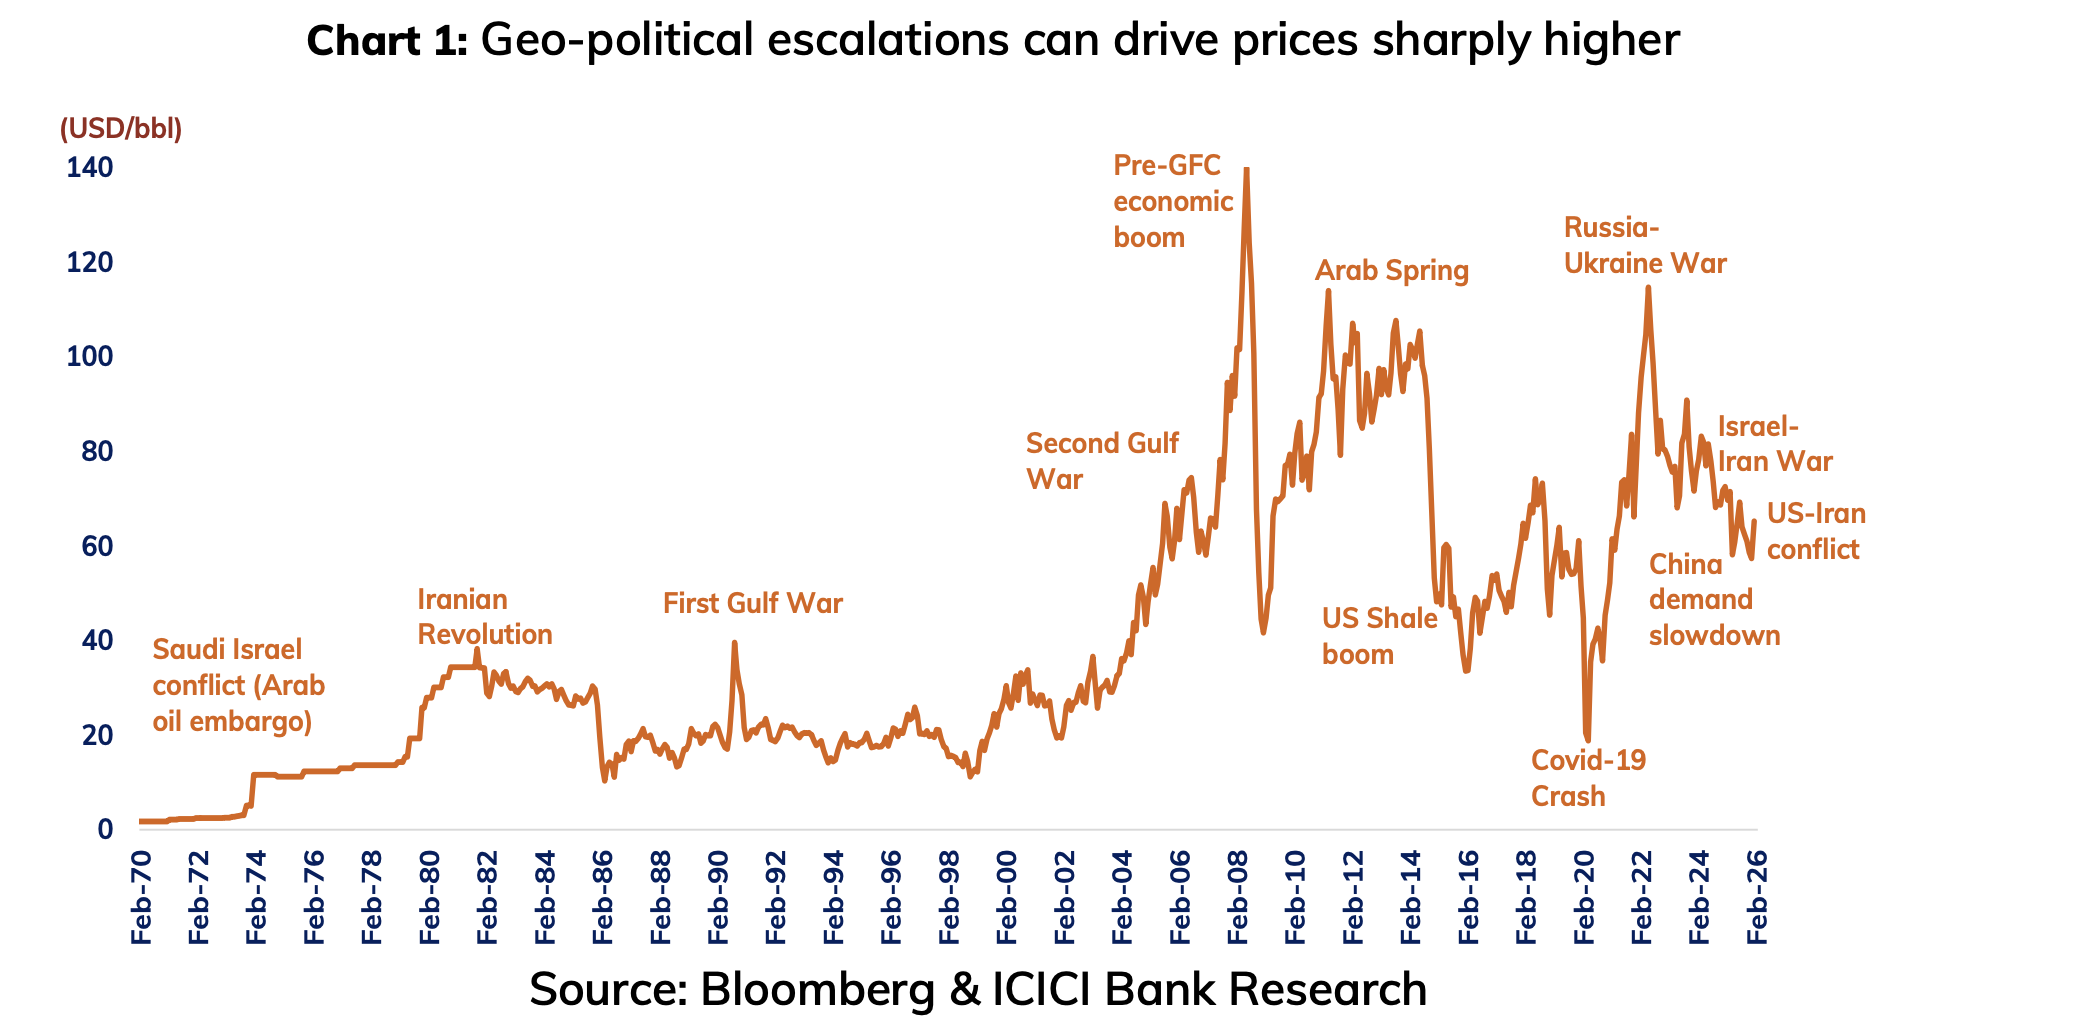
Past oil shocks provide context. Historical episodes show energy prices can jump 10–90% in conflicts, but medium-term effects vary with demand and supply fundamentals .
For example, Brent initially surged ~23% early in the Russia–Ukraine war (2022) but fell in the following 1–2 years as supply held up . In contrast, after the 2003 Iraq invasion and the 2010 Arab Spring, oil prices remained structurally higher for years .
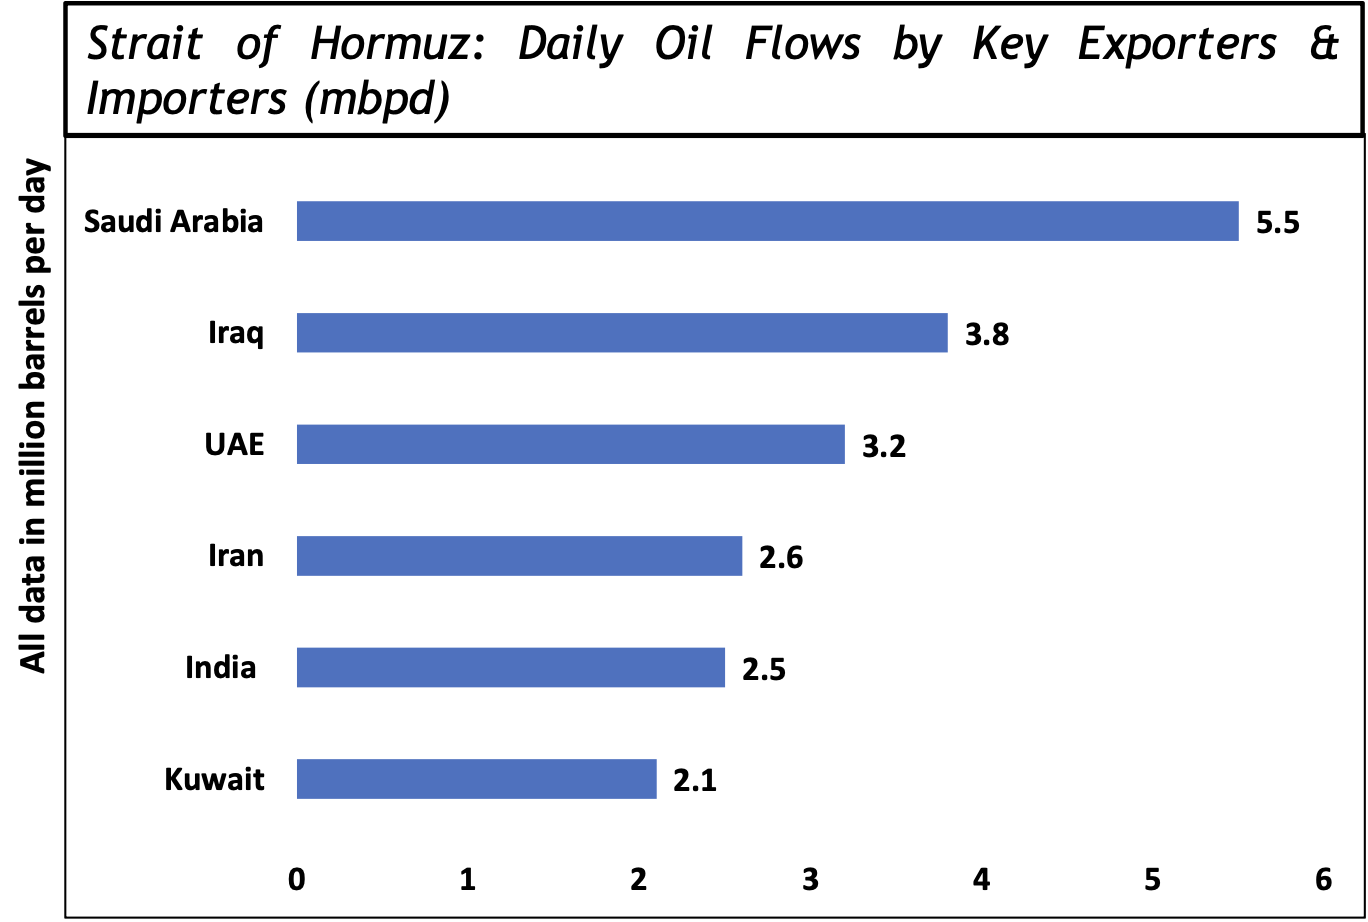
These differences underscore that today’s impact will depend on underlying supply/demand balances: global production was growing faster than demand into 2026 . Indeed, as of early 2026 the oil market was over-supplied; inventories were high and OPEC/non-OPEC production was ample. ICICI Bank’s data show a surplus around 4 million barrels per day in late 2025 – roughly equal to Iran’s entire output. There is also significant OPEC spare capacity (~4.6 mbpd, led by Saudi Arabia with ~2.4 mbpd) that could make up for lost Iranian barrels in the near term . Alternative pipelines (Saudi East-West, UAE Fujairah) can divert up to ~3 mbpd around Hormuz . These buffers mean that, unless actual production facilities are damaged or a blockade persists, immediate shortages may be limited.
Nevertheless, even the perception of risk is moving markets. Monday (Mar 2) saw Brent jump ~9% to around $79–80/bbl , reflecting war fears. Traders cite “risk premia” – extra price for the chance of disruption. Analysts caution that this modest jump suggests markets are betting on a short-lived shock . Reuters commentators note that if exports resume quickly, even major Gulf producers could tap huge stockpiles or pipelines via the Red Sea, tempering the impact. But if the Strait stays closed for days or weeks, “every day of disruption compounds pressure on producers and consumers alike” . In that case, onshore storage would fill rapidly (Saudi reserves might be exhausted in ~10 days at current flows ) and prices would climb steeply. Thus a key market cue to watch is the actual flow of oil out of the Gulf (e.g. tanker AIS data) – not just headlines . (For example, so far the Strait has not been officially closed and about 150 tankers are simply avoiding the area . No barrels are moving through, but physically lines are up. Media reports of a “closed Hormuz” (a fifth of world oil) omit that nuance. In short, analysts urge: oil markets must distinguish a pure risk premium spike from an actual supply outage.)
 Global macro transmission
Historically, oil supply shocks translate into higher inflation and slower growth (stagflation). A spike in energy costs acts like a negative terms-of-trade shock for importing countries: they need more foreign exchange (or exports) to purchase the same oil, which widens trade deficits and worsens real incomes. The International Monetary Fund estimates that a permanent 10% rise in oil prices would shave roughly 0.2–0.3 percentage points off global GDP growth and add ~0.4 percentage points to inflation . In practice, the effects differ by economy. In the U.S., higher oil would compound existing inflation pressures (from tariffs and tight labor markets) and slow consumer spending. If oil stays permanently 10% higher, U.S. inflation might settle closer to 3% (rather than ~2.6% expected) by end-2026, and private consumption could cool more sharply . This, in turn, would likely force the Federal Reserve to delay any rate cuts: indeed, market pricing for Fed easing has already been pushed back. In short, a sustained price shock would be a real interest rate negative: with inflation up, central banks would remain more cautious. In contrast, if crude falls back by H2 2026 (as base cases assume), the global growth impact may be muted and inflationary blip short-lived .
FX and financial marketsA major risk-off episode tends to boost traditional safe havens. Research teams now see the U.S. dollar as the main winner. ICICI Bank projects the DXY index rising to the high 90s – even testing 100 – as investors flock to dollar assets and U.S. Treasuries . Among major pairs, EUR/USD is expected to hold roughly 1.16–1.19 (Europe still posting decent growth), and USD/JPY may rise into the 154–158 zone given Japan’s large oil import bill . Commodity currencies and other oil importers have already weakened. For example, USD/INR moved toward 91.50 on March 2 (up about 0.5%) , and analysts forecast INR rising further to the ~90.5–92.5 range . The rupee’s losses reflect both the direct hit to India’s current account and general emerging-market risk aversion. Among emerging Asia, China’s yuan could also weaken (near 6.90 USD/CNY), while currencies like the Malaysian ringgit, Indonesian rupiah etc. are broadly at risk.
Global equity markets have turned cautious. U.S. futures dipped ~1% on the initial news , and India’s Sensex fell ~1.3% intraday . A prolonged “long war” might shatter sentiment: UBI Research’s scenario matrix suggests a 15%+ slump in global stocks if the worst-case shock unfolds . In contrast, a quick resolution could see a modest dip followed by a rebound. Commodity markets are behaving as expected: gold and other precious metals have rallied on safe-haven demand (gold is up ~2% to ~₹5,330/gold on March 2 , though price in USD remains around $2,100/oz), and base metals and oil have jumped on supply-fear. Shipping insurance rates and freight costs are also moving higher, as insurers reprice risk in the Gulf.
Scenario matrix (Key outcomes)Putting the above together, analysts outline three main scenarios:
- Quick Resolution (Weeks): Iran’s new leadership negotiates a deal within ~2 weeks; no full oil cutoff. Oil prices would likely peak quickly (say WTI $68–72, Brent $80–95 by month-end ) and then ease back as exports resume. Global equities would recover (S&P near flat or slightly higher), and financial conditions would normalize. Emerging currencies like INR might even strengthen as the premium unwinds. In India, any CAD impact would be limited (manageable with current reserves), and inflation rise would be modest. This scenario relies on, say, a political settlement or a rapid tactical pause. Key indicators: news of a diplomatic deal, shipping AIS data showing resumed flow, and intact Iranian command structures .
- Base Case (4–6 Week Conflict): Strikes and retaliations continue for a few weeks; Iran avoids fully closing Hormuz. Oil trades higher but mostly in premium; ICICI and UBI both see Brent mostly under $95 . Inflation edges up globally (especially fuel/energy CPI) but central banks can look through it if transitory. USD strengthens (DXY ~98) and volatility stays above normal, but not every stock index crashes. For India, imported inflation and CAD worsen (each $10 spike adds ~$14–17bn to the deficit ), but the hit is partly absorbed (by oil companies’ margins, moderate excise cuts) so core CPI stays relatively contained. RBI likely holds rates, emphasizing structural factors, while the Finance Ministry quietly budgets for higher subsidy needs. Equities may slide a few percent (UBI: S&P -3% to -8% from the recent peak ), but stabilizing once risks abate.
- Long War / Escalation (Months): Iran’s IRGC resists change, the Strait remains blocked 3+ weeks, and proxy groups flare up across the Middle East. Oil becomes genuinely scarce: Brent rapidly tests $100–120+ . This feeds into a global stagflation scenario. Central banks face a dilemma: while slowing growth pressures mount, stubbornly higher inflation prevents any easing. Expect U.S. 10-year yields to rise (inflation worries) after an initial safe-haven rally. Global stock markets could plunge (~15%+ losses ), especially commodity-intensive and growth sectors. Emerging markets suffer “full meltdown” – DXY over 100, widescale capital outflows, EM currencies down double-digits. In India, the strain on the current account and fiscal balance would be severe: UBI estimates roughly $48bn added to the FY26 CAD if oil rose +$30/bbl (pushing the deficit over 1% of GDP). The rupee could weaken markedly beyond current levels . Inflation would climb as any fuel price rise eventually passes through, especially if the government eases controls to share pain. Fiscal trade-offs intensify: more subsidies or higher taxes become unavoidable. In this dire scenario, markets would watch clues: e.g. a breakdown of Iranian command (“regime collapse”), or diplomatic interventions by Russia/China (they have thus far only offered verbal support), could signal a possible turn.
As one of the world’s largest oil importers, India stands to feel the impact acutely. Pre-crisis, about 55% of India’s oil came from the Middle East (as of January 2026) , and roughly 40% transits Hormuz . India’s strategic reserves cover only ~74 days of consumption (less in practice, with current inventory ~20–25 days) , far below China’s ~180 days. Hence a Strait blockage poses supply risk. A price jump already seen (Brent at ~$79 vs ~$66 budgeted for FY2026) means the current account will worsen. ICICI’s model implies each $10 rise adds ~$14bn to the CAD (0.3–0.4% of GDP) – in line with UBI’s $16–17bn estimate . This suggests FY26’s deficit could exceed $35bn (0.9% GDP) and approach 1.0% in FY27 if oil stays high . The higher deficit (and likely narrower capital inflows) will pressure the rupee beyond what would otherwise have been the case. In practice, some of the shock is offset by India’s large service and remittance surplus. RBI data show that strong services exports ($180.6bn surplus in FYTD26 vs $103.1bn oil deficit) and record remittances (> $100bn/year) cushion the impact . Graphs of recent years illustrate how rising invisibles have reduced the current-account’s oil sensitivity . India also has ample forex reserves (~11.5 months of imports) to smooth volatility .
Nonetheless, immediate channels are clear. Domestically, nearly 7% of the new CPI (6.8%) is in fuel items (petrol, diesel, LPG) . A sustained oil spike will ultimately raise inflation: A full pass-through of $10 would add ~40–45 bps to headline CPI, plus another 10–15 bps indirectly via higher input costs . In reality, much is regulated: pump prices are frozen through a mix of taxes and company margins. So far, as in recent years, the government has absorbed upstream volatility – cutting excise/VAT or letting OMC margins shrink – to keep retail prices steady . (Indeed, India’s retail fuel CPI has been virtually flat for years despite oil swings .) But this has a cost: Oil-gas tax revenues (2.9% of GDP in FY23) have fallen to ~2.2% by H1FY26 as duties were cut . Any further fuel subsidy would widen fiscal deficits.
The monetary policy reaction is likely to be cautious. Both ICICI and UBI see the RBI standing pat. The recent oil-led inflation is not strong enough yet to derail the disinflation trend (especially since domestic prices are capped). UBI explicitly notes a “prolonged pause” is warranted . If needed, RBI can use liquidity tools rather than rate moves to smooth volatility. In summary, investors should expect Indian rates to remain on hold in the near term, unless inflation surprises.
Macro primers (contextual notes)For clarity, an oil price rise affects the economy through several channels:
(1) Inflation: Energy is a basic input (for transport, production, power). A fuel price hike first lifts headline CPI; this can then feed into core inflation as costs ripple through manufacturing and services. (2) Income: Consumers face higher living costs and lower real income, which can curb consumption and growth. (3) External accounts: Oil importers pay more in foreign currency, worsening the trade balance (a terms-of-trade loss). (4) Monetary policy: Central banks may react to higher inflation by raising or not cutting rates, which slows the economy further. Historically, oil shocks often lead to temporary “stagflation.”
For example, the 1973 embargo quadrupled crude prices and triggered both high inflation and recession. More recently, crude doubled in 2007-08, feeding global inflation and a downturn; conversely, when oil spiked in 2022, prices later fell as supplies held up. The current analysis incorporates these lessons: initial price jumps may moderate if supply is restored, but the risk of persistent inflationary pressure grows with conflict duration.
It is important to distinguish measured analysis from headline-driven framing. News outlets have emphasized dramatic developments (“Hormuz closing,” “Khamenei killed,” “global energy crisis”) . Research reports take a more granular approach. ICICI notes that “so far…no large-scale impact on oil infrastructure” and that existing stockpiles and pipelines mitigate near-term shortages . They caution that insurers have merely halted, not completely blockaded, Gulf shipments . Similarly, a Reuters commentary observes that the market’s relatively modest initial oil jump implies investors hope for a short-lived shock , though it also warns complacency may be risky.
For investors, this episode is a test of macro literacy and patience. The key is conditionality: any market move should hinge on how long and widespread the conflict becomes. A short-lived flare-up (few weeks) is unlikely to derail global growth or equities materially; in that case one might focus on fundamentals (e.g. technology or domestic consumer sectors) rather than high-beta commodities. A drawn-out confrontation, however, would tilt economies toward slower growth and higher inflation, favoring defensive assets (quality stocks, inflation-hedges) and global diversification.
Monitor the signals
Crude price levels (above $90–100 sustained?), central bank communications on inflation, and India-specific metrics (fiscal deficit revisions, currency moves). Note that the Reserve Bank has room to ease liquidity if markets stress.
Stay informed on core macro trends – inflation data, current account flow, fiscal deficits – and use this event as a stress test of one’s understanding of macroeconomic transmission channels (oil → CPI → rates → growth).
In summary, the US–Israel–Iran conflict has raised the risk of a global oil shock, but the ultimate outcome is uncertain. Analysts emphasize a calm, scenario-driven approach: build in the possibility of $100+ oil if Hormuz stays shut, but also recognize that large inventory buffers and spare capacity can cap the pain in the near term . For Indian readers, the salient points are: the rupee may weaken further, fiscal subsidies may rise, and RBI will likely wait on rates . A sound response is to watch developments closely, diversify risk, and avoid reacting to sensational headlines.
References: Key data and scenarios above are drawn from ICICI Bank and Union Bank research reports on the conflict , along with Reuters market commentary . Embedded primers and assumptions (e.g. oil-GDP sensitivities) are cited from these sources.